- The AI Finance Frontier
- Posts
- High-frequency factors for intraday trading strategies
High-frequency factors for intraday trading strategies
How can high-frequency factors improve intraday market return predictions?

Hi! Here's Iván with this week's exciting newsletter, brimming with insights and discoveries on building robust investment strategies and risk models using Machine Learning.
In this edition, I am presenting the following sections:
🕹️ AI-Finance Insights: I summarize three must-read academic papers that mix cutting-edge ML/DL with Asset Pricing & Quant Finance:
Intraday Market Return Predictability Culled from the Factor Zoo
Forecasting the Equity Premium: Do Deep Neural Network Models Work?
Factor Timing
💊 AI Essentials: The section on top AI & Quant Finance learning resources: Today, I'm thrilled to share an excellent video from the Algorithmic Trading Club at the University of Washington Seattle. This 30-minute session on "Machine Learning Optimization in Modern Portfolio Theory" covers everything from the basics to simple ML applications for portfolio optimization, making it perfect for beginners.
🥐 Asset Pricing Insights: In this edition, I recommend the study "Complexity in Factor Pricing Models," which addresses the question, "How does complexity affect factor pricing models?" This paper shows how highly parameterized ML/DL models lead to improvements in out-of-sample performance.
Today’s Sponsor
Make your money rise and grind while you sit and chill, with the automated investing and savings app that makes it easy to be invested.
AI-Finance Insights
“Intraday Market Return Predictability Culled from the Factor Zoo”

The paper leverages LASSO and financial econometrics to forecast market returns effectively.
The study makes several key contributions:
👉 Lagged Cross-Sectional Returns: The paper demonstrates strong intraday market return predictability using lagged high-frequency returns from a broad set of risk factors. This approach captures nuanced market dynamics.
👉 Predictive Power: LASSO regularization effectively distills pertinent information, differentiating between continuous and discontinuous price increments. This enhances model robustness and predictive accuracy.
👉 Economic Mechanisms: Superior performance is traced to periods of high economic uncertainty, driven by factors related to tail risk and liquidity. This suggests slow-moving capital and gradual information incorporation as underlying mechanisms.
👉 Trading Performance: Strategies utilizing these forecasts generate impressive out-of-sample Sharpe ratios and alphas. For example, a market timing strategy on the SPY ETF achieves an annual intraday Sharpe ratio of 0.79, compared to 0.09 for a buy-and-hold strategy, with an annualized Fama-French six-factor alpha of 7.99%.
👉 Key Factors: SHAP value decompositions highlight liquidity and market friction factors as primary drivers of Sharpe ratios and alphas, aligning with classic return cross-autocorrelation findings.
In summary, the paper underscores the potential of high-frequency cross-sectional returns and LASSO regularization in predicting intraday market returns, offering substantial economic gains and robust performance during volatile periods.
“Forecasting the Equity Premium: Do Deep Neural Network Models Work?”

📢 Do deep neural network models really outperform traditional methods in equity premium forecasting? Can they improve your investment strategies?
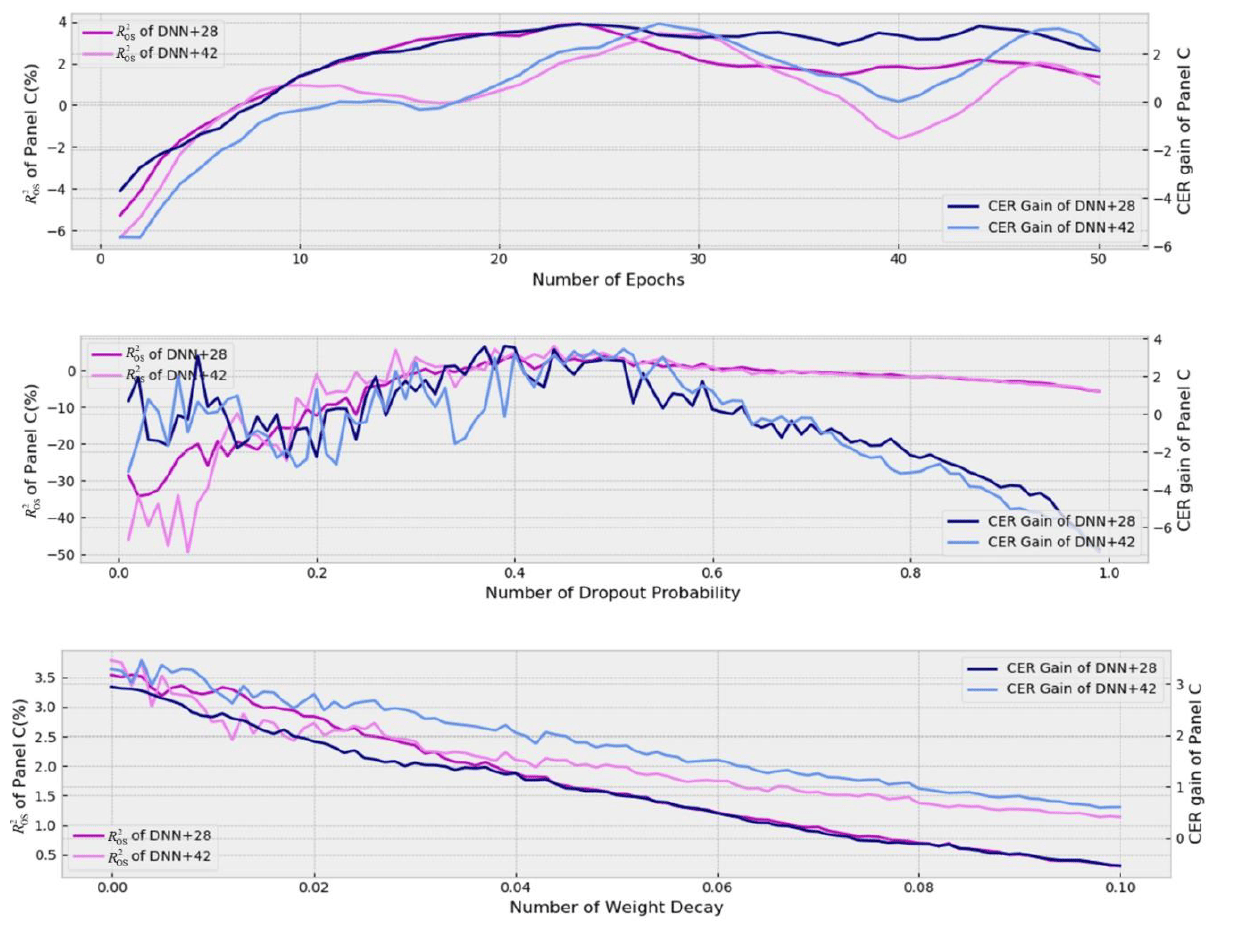
The paper evaluates the effectiveness of deep neural networks (DNN) in predicting the equity premium compared to ordinary least squares (OLS) and historical average (HA) models.
Simple and clean empirical approach, quite easy to follow.
👉 Predictive Accuracy: The DNN models demonstrate significant out-of-sample predictive power. For the period 2011:01 to 2016:12, the DNN+42 model achieves an out-of-sample R2 of 3.81%, whereas the OLS+28 model shows no predictive ability with a R2 of -5.02%.
👉 Sharpe Ratios: The DNN models deliver superior Sharpe ratios. The DNN+42 model achieves a monthly Sharpe ratio of 0.33, significantly higher than the 0.16 achieved by the OLS+28 model for the same period.
👉 Economic Gains: The DNN models provide substantial economic value for investors. For instance, the DNN+42 model generates an annual utility gain (CER gain) of 2.99% from 2011:01 to 2016:12, highlighting its effectiveness in practical investment scenarios.
👉 Enhanced Models: By incorporating 14 additional predictive variables, the DNN+42 model further improves performance, demonstrating the value of extensive data inputs and advanced machine learning techniques.
“Factor Timing”

💡How to Predict Factor Models Effectively? This paper provides must-read practical insights. 👇
The study provides some important results:
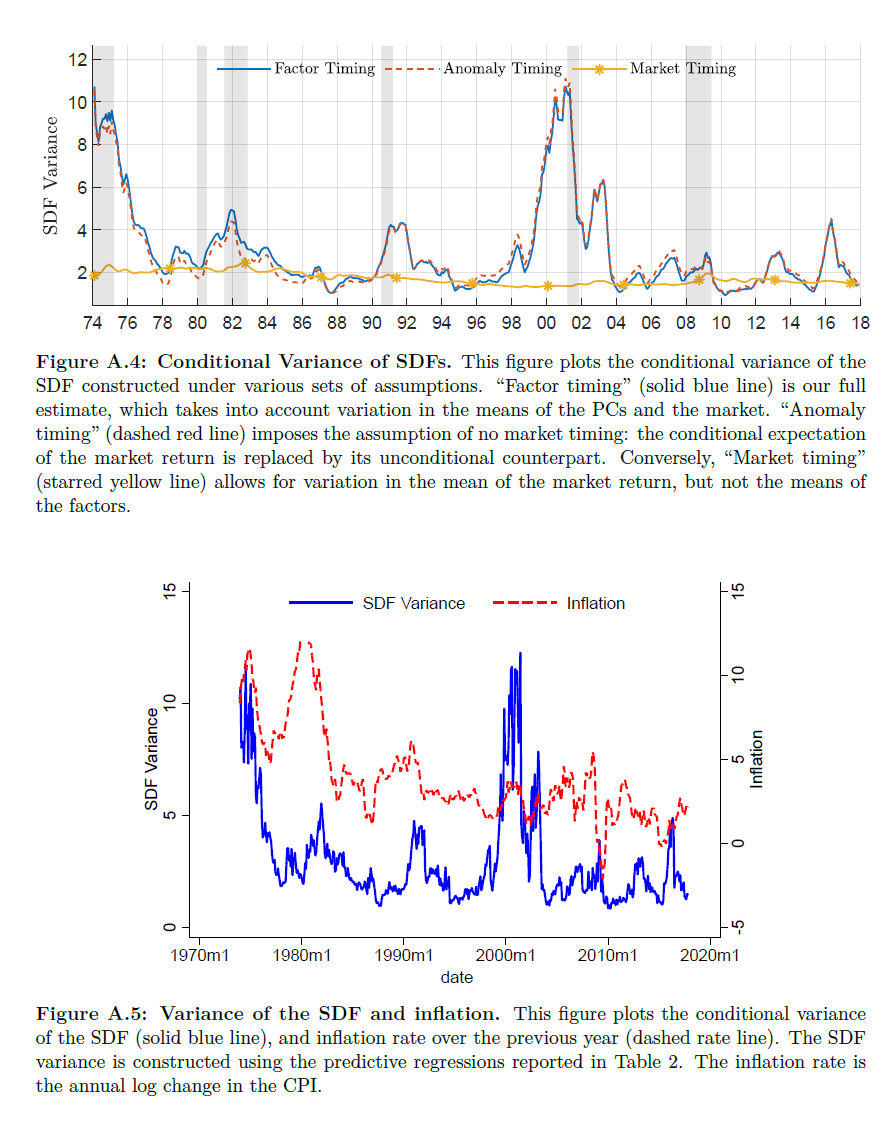
👉 Principal Component Analysis (PCA) Factors: Using PCA to focus on the top five principal components (PCs) of anomaly portfolios, the model captures nearly two-thirds (74.7%) of the total variation in returns. This method shows strong predictability, with the first PC having an out-of-sample (OOS) R² of 1.00%.
👉 Predictive Regression Performance: By leveraging the log book-to-market (bm) ratios of anomaly portfolios as predictors, the model achieves a robust OOS R². The predictive power of the first and fourth PCs is particularly notable, showing large and significant coefficients with t-statistics around 4.
👉 Robustness Tests: The model remains robust across different specifications, including varying the number of PCs, holding periods, and adjustments for market returns. The main specification shows an OOS total R² of 0.93%, demonstrating the model's stability and reliability in different settings.
👉 Comparison with Other Methods: The proposed method outperforms several other forecasting approaches. For instance, using each portfolio's own bm ratio yields higher predictive performance than methods like ridge regression or Lasso. The method's OOS total R² surpasses those of alternative approaches, confirming its effectiveness.
In summary, the paper highlights that focusing on the largest principal components of anomaly returns, and using their own valuation ratios as predictors, can significantly improve the prediction of cross-sectional returns.
This approach provides valuable insights for both academic research and practical investment strategies, demonstrating that a few dominant factors can effectively capture the cross-sectional variation in expected returns.
Sponsor 👇
Ride the wave of 23% compounded annual growth
That’s the forecasted growth rate of the smart shades between 2023-2033. And RYSE’s automated window shade tech is positioned to dominate the market. They’ve generated over 20X growth in share price for early shareholders, with significant upside remaining as they launch in over 100 Best Buy stores. Invest in the rapidly growing smart shades market →
AI-Essentials
📹 Check out this “short” session from the Algorithmic Trading Club at the University of Washington Seattle. In this 30-minute video, you'll learn about "Machine Learning Optimization in Modern Portfolio Theory," covering the basics and simple ML applications for portfolio optimization. Perfect for beginners! 👇
Asset Pricing Insights
“Complexity in Factor Pricing Models”

How does complexity affect factor pricing models? The paper shows how highly parameterized ML/DL models lead to improvements in out-of-sample performance.
The study makes several key contributions:
👉 Virtue of Complexity: The paper demonstrates that asset pricing models with an extremely large number of factors (even more than the number of training observations) significantly outperform simpler models. This challenges the traditional belief that a small number of factors should capture the risk-return tradeoff.
👉 Empirical Results: Models with many factors achieve higher out-of-sample Sharpe ratios and lower pricing errors. High-complexity models (with more parameters than observations) consistently outperform traditional low-dimensional models, such as the Fama-French model.
👉 Sharpe Ratios: The out-of-sample Sharpe ratios of high-complexity models exceed those of simpler models. For example, the empirical "VoC curves" indicate that increasing the number of model parameters enhances the out-of-sample SDF Sharpe ratio and reduces pricing errors.
👉 Robustness: The improved performance of complex models is robust across different subsets of the stock universe, including large and liquid US stocks.
In summary, the paper highlights the significant advantages of using highly parameterized models (ML/DL) in asset pricing, showing that these models can capture more information and provide better out-of-sample performance compared to traditional, simpler models.
If you're enjoying our newsletter and want to support us, please recommend it to anyone you know who's interested in AI and Finance. Your referrals are the biggest compliment and help us grow! 🌟🤖💼

